


JANUARY 21 — Is there a way to contain the spread of an infectious disease nationwide that is more favourable to livelihoods without sacrificing lives and still prevent future clusters from emerging? Probably.
With more representative data, higher testing capacity, better contact tracing and data analysis techniques, the resulting better understanding of what gives a virus spread its momentum may allow authorities to make targeted interventions (such as tailored MCOs) that target significant contributing factors that cause virus spread, instead of a blanket approach of a nationwide lockdown.
Let’s start with the need for a more representative data for better tracing and analysis. Instead of just the widely-known ‘R’ number (reproduction rate number; R0), we should also be considering the dispersion factor ‘k’.On its own R is insufficient to evaluate the nature and dynamic of an infectious disease spread in the population.
Many perhaps already understand that R equal to, say, 1.5 means that at average every infected individual has infected 1 to 2 other individuals. However, R = 1.5could also mean that for every 100 infected individuals, who diligently self-quarantined themselves and therefore did not infect anyone, there was one individual who has managed to transmit the disease to least 150 others. R = 1.5 could also mean many other possibilities on a continuum between these two extreme cases.
In other words, on an individual level, rather than nationwide, R is a random variable and reported R is only its expected value. However, it is equally important to understand how R is distributed in the population—how each individual’s R deviates from this expected value.
By now it is already a well-established empirical fact that Covid-19, like other representatives of the coronavirus family, R appears to follow negative binomial distribution which means that the virus tends to spread in a population unevenly, or in bursts. The following graphic illustrates and explains this dynamic.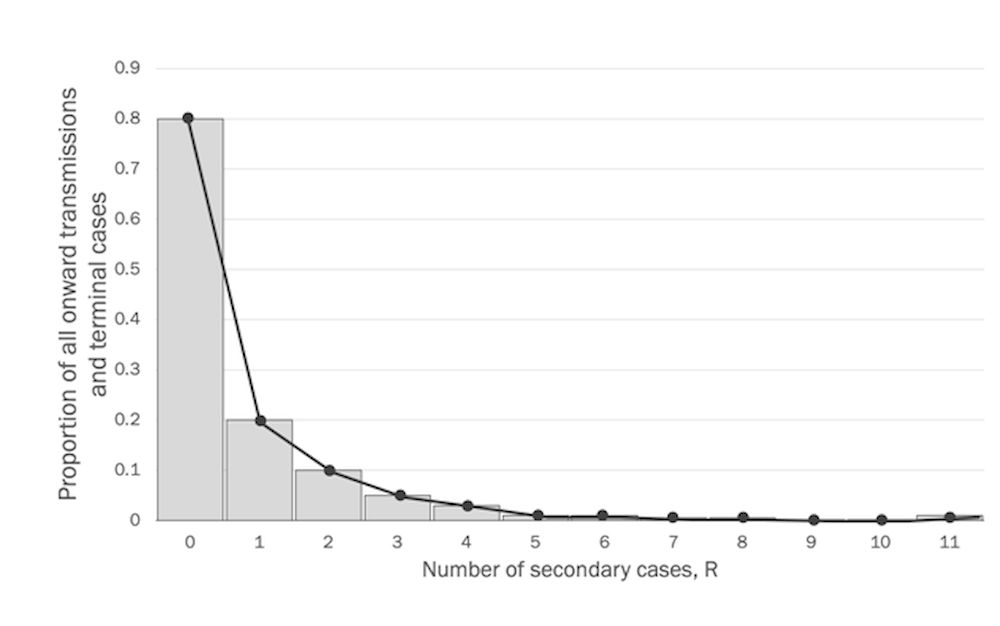
This graph, modelling the distribution of R for a sample of actual Covid-19 cases data, indicates that the distribution of R is over-dispersed to the right. This means that the overwhelming majority of Covid-19 infected individuals transmit the infection to either none or 1 individual (left-hand behaviour of the graph).At the same time, there are very few individuals (right hand of the graph) who transmit the disease to substantially larger number of others, which is referred to as a “super-spreading event” (SSE).
In other words, these few “super-spreaders” are responsible for as much as 80 to 90 percent of all transmissions in the sample, as another researcher Zeynep Tufecki from the University of North Carolina, notes in The Atlantic. Yet, another researcher, Amy Barret in Science Focus reported a similar ratio of 80% cases from just 10% of all infected individuals.
Now, the measure that allows us to evaluate this over-dispersion of R, and therefore presence of SSE in the population, is the less-famous k coefficient of dispersion. In simple terms in this context, k indicates how “squeezed” the distribution of R is to the left. Low values of k means that the distribution is very squeezed to the left and has that longer tail to the right (just like in the graph above)—indicatingpresence of SSEs!
Barret reported the k number for Covid-19 (SARS-CoV-2) of around 0.1, which is relatively very low number. For comparison, according to a 2005 publication in Nature by Lloyd-Smith and co-authors, SARS-CoV (‘closest’ to Covid-19) had a similar k value of 0.16 while the 1918 flu pandemic had a k value of 1, pointing to a more even spread and not so much contribution by cluster events.
Understanding this peculiar nature of Covid-19 transmission suggeststhe idea that if we had the effective measures in place to prevent, in general, as well as quickly identify and isolate super-spreaders and SSEs we could go with a lighter version of the movement control rather than blanket total lockdown.
Therefore, understanding what differentiates these ‘super-spreading individuals’ from non-infecting ones and what constitutes a SSE are key to designing high-impact specific interventions with minimal repercussions to non-contributors.
So, what are the triggers of a SSE?
As this is a developing field of study, we can’t say for sure we have all the set of circumstances but current data points to the obvious: Enclosed spaces, close-contact, emotional events (with singing or loud speaking), and exposure for a period of time. Not wearing masks (due to eating, talking, shouting or other increased human interaction) can increase the risk of transmission because the virus mostly spreads via water droplets from our mouth and nose which is why poor ventilation as well as air pollution (presence of heavy chemical particles in the air) may also be a critical factor.
Every country and locality may have unique contextual circumstances leading to such events. As such, we need to conduct in-depth qualitative inquiry for each unique case of SSE. We need to understand each unique super-spreader individual which may include demographics, background, unique patterns of behaviour and social interaction, genetics and underlying physiological factors.
Mining the data gathered by MySejahtera may also greatly facilitate us in developing specific list of potential contributing factors of a SSE, which may be further used to ‘predict’ potential clusters and help draft a more targeted intervention. Identified unique country specific factors leading to SSE can be built into the prediction models and integrate important estimates as R and k.
But how do we identify and isolate potential super-spreader individuals or SSE? This is where combining the k factor with ‘retrospective’ contact tracing may help.
Typically, ‘forward’ contact tracing tries to identify the people that a Covid-19 positive individual may have been in contact/close contact. Working ‘backwards’ means trying to determine who transmitted the virus to the positive individual in the first place or the ‘original transmitter’. As reported by Tufecki, conducting forward tracing from these ‘original transmitter’ individuals mean we’ll find many more cases. The entire approach combining forward and backward methods is known as retrospective contact tracing.
Individuals traced using this method could be potential contributors to SSEs that may have otherwise gone under the radar by forward tracing alone.
Understandably, our health infrastructure is already overburdened. There’s no point in detecting more people but not being able to ramp up tracing, testing, isolation and treatment. As such we support the call “to ramp up testing with triaged, mass and frequent testing regimen, utilising inexpensive rapid testing kits” as per the suggestion by experts in an open letter dated January 7 to the Prime Minister, whereby the PM has responded that the experts’ call is line with Health Ministry’s (MOH) past and current efforts.
In improving the calculation and use of the k factor, we also support the call for “automating contact tracing with digital apps” and “leveraging on data science and machine learning to identify the hotspots in the nation for targeted screening to support the Find-Test-Trace-Isolate (FTTI) rapid response to bust the Covid-19 clusters and mitigate the sporadic spread of the coronavirus” as recommended in the open letter.
For now, we have to get the numbers and frequency of cluster breakouts down again before we can reliably use the k value. Tufecki referenced an expert in epidemiology whom highlighted that when cases are high (as is observed right now), the spread characteristic (on-paper) is ‘flu-like’. Due to physical limitations, we observe that countries whose healthcare system operates at the maximum of its capacity in managing the Covid-19 begin to report approximately the same number of cases every day—this greatly disturbs representativeness of both measures, R and k.
This is why a strict enforcement of MCO 2.0 and personal adherence to SOPs is critical at this very moment. Getting numbers under control right now will allow us to re-strategise. Being equipped with better understanding of the various factors that could trigger a super-spreading event, intervention strategies such as MCOs could be tailored to preventing these various factors from coming together.
This could allow us to embark on rationalisation plans and see in detail how likely certain industries, locations, events, and other factors can become a super-spreading event. These targeted measures could be supported in parallel by continuous retrospective contact tracing with consideration of the k factor and mass testing to increase FTTI to proactively hunt for potential super-spreading events.
Understandably, it’s clear that these specific measures hinge on effective on-site enforcement of SOPs and people’s discipline to adhere to it.
Needless to say, inability to do this reliably and consistently could be why authorities have to resort to a blanket approach instead of a targeted one. However, the formation of the Covid-19 advisory panel, the response to the open letter, PERMAI stimulus, increase in budget allocations to MOH and other organisations to fight Covid-19 are clear signs of the focus of the authorities in this critical time.
Dr. Margarita Peredaryenko and Ameen Kamal are part of the research team at EMIR Research, an independent think tank focused on strategic policy recommendations based on rigorous research.


