KUALA LUMPUR, June 24 — To most people, Malaysia’s official inflation rate is a perennial mystery.
The Consumer Price Index (CPI) released by the Department of Statistics (DoSM) — which tracks the changes in prices of essential goods and services over a period of time — is often dismissed as hogwash because they feel it captures little of their shopping experiences.
Perhaps the biggest reason why the index seems unconvincing to the average consumer is that the way it’s calculated can appear to suggest all households experience the impact of inflation the same way.
In reality, that impact can feel starkly different from one household to another. Variables like income, spending habits or even geography can make inflation feel harder or less significant, which the CPI tends not to reflect.
For example, a couple who stays in the upper-middle-class suburbs of Bandar Utama will likely have to pay more for dining out compared to someone who stays in the working-class parts of Cheras or Dengkil.

To make sense of this disconnect between the official inflation rate and how individual households experience it, Malay Mail worked with Zouhair Rosli, an economist with public policy outfit DM Analytics to formulate what we hope is a simpler index to show how different spending habits will result in different inflation rates.
We call it: the Cik Kiah Index, in a nod to the everywoman character introduced by Putrajaya in 2020 — or CKI for short.
What is in Cik Kiah’s shopping basket?
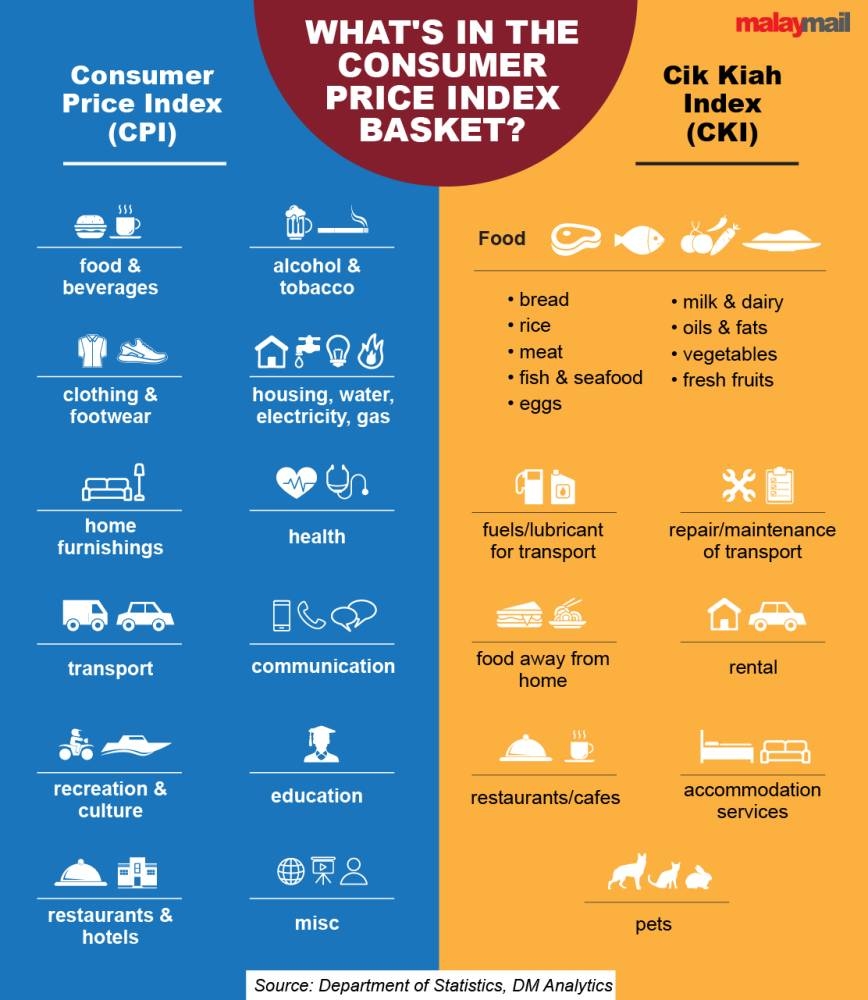
A typical CPI "basket" tracks the price movements of 552 different goods in services, split into 12 main groups.
These include the typical food and beverages, clothing and transport, to items that may not be considered essential such as alcoholic beverages, tobaccos, restaurants, hotels and home furnishings.
According to Zouhair, this way of calculating the CPI can feel as if it obfuscates what consumers feel because the resulting rate seems smaller compared to actual price hikes since the price fluctuations among all these hundreds of items vary highly.
“So what this Cik Kiah Index does is give an alternative picture as to how inflation affects each of us differently. Knowing the inflation rate is actually higher will likely resonate better with people on the streets,” Zouhair told Malay Mail.
To formulate the CKI, we look at just crucial goods and services from this CPI basket that best reflect a typical bottom 40 per cent (B40) households and omit the rest.
Items deemed crucial include foodstuff such as rice, meat, vegetables and egg, fuel, eating out, and rental.

Doing this allows the CKI to remove possible distortions caused by the price fluctuations of goods and services that are not typically consumed. Instead, it tracks price inflations of only items that B40 households would likely spend on.
As a result, tracking price changes between April 2021 and April 2022 would result in the CKI showing an inflation rate of 3.3 per cent. This is 1.4 times higher than the official headline inflation rate of 2.3 per cent over the same period.
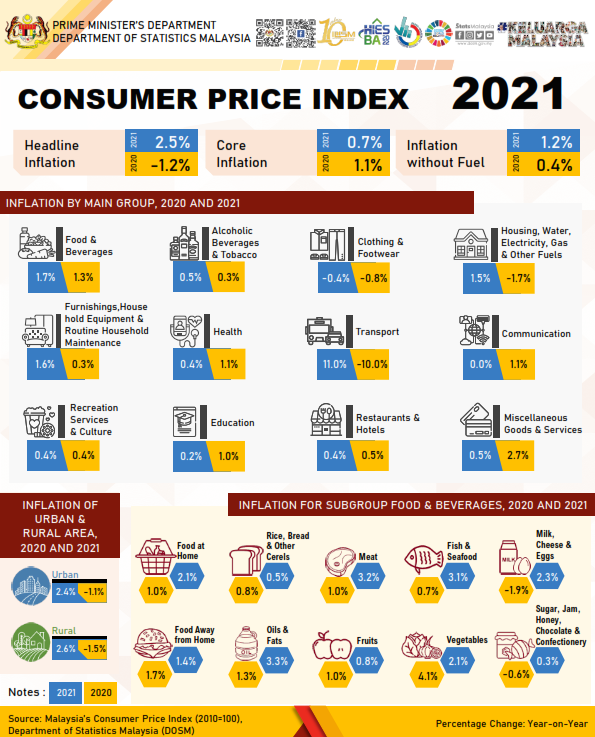
Official headline inflation rose by 2.5 per cent in 2021 compared to the year before. Meanwhile, April’s CPI rose 2.3 per cent compared to the same period the year before.
Can you cut down on your inflation?
The CKI shows that the personal inflation rate can differ even between households from the same income bracket.
One B40 household could feel the price pressure more if members are forced to eat out most of the time, compared to a B40 household that mostly cooks their meals at home. The personal inflation rate of the latter family would have fallen by three percentage points to 3 per cent.
But even prices of raw ingredients have soared thanks to a prolonged global supply chain disruption that is now exacerbated by a weak ringgit.
The CKI shows that cutting meat or seafood would only reduce a household’s personal inflation rate by just one percentage point to 3.2 per cent, barely noticeable compared to the household that frequently dines out. That’s because meat usually makes up the largest chunk of a household’s food budget, influencing the CPI significantly.
The global supply bottleneck has even made the prices of food that can be substituted more expensive. The CKI shows that removing meat from your diet will do little to alleviate price pressure.
Suppose a household turns to plant-based meals and cuts back on fish and meat to reduce their budget, the CKI showed their inflation rate will drop to just 3.1 per cent.
They can remove meat, seafood, and also vegetables, which would cut the CKI further to 3 per cent. But you’re left with not much else to eat at this point.
The biggest fall in the CKI would come from removing the use of cars for transport, leisure, and seafood — down to 2.9 per cent, but these aren’t items even low-income households can do without.
In May, inflation in prices of food and drinks sold at eateries rose by 4 per cent year-on-year, the spillover effects of rising prices of raw ingredients.
A plate of chicken rice, for example, is now RM7.22 and RM6.20 in KL and Selangor respectively, a 6 per cent increase in April. Teh tarik price rose 9 per cent within the same period.
The price changes, though seemingly small, will add up the more frequently you eat out so reducing the frequency will help scale back your overall inflation rate.
The CKI showed your personal inflation rate could go as low as 2.9 per cent, but only if cut back on those ice cream trips or the occasional weekend splurge at the mall, which can be the only few leisure items that a majority of families from the lowest-paid bracket can afford.
Coping with inflation wherever you are
The average CKI for low-income households could also have been heavily influenced by the neighbourhood they stay in, but Zouhair said it would have been harder to capture the differences in the inflation rate through a simple index like the CKI.
A B40 household that lives in Klang, Selangor, would have paid RM8.90 for a kilogramme of processed chicken, resulting in a lower inflation rate. That same family would have had to pay RM11 for the same item in Gombak — that’s an increase of between 13 to 14 per cent.
Residents of Selangor and the Federal Territory of Putrajaya experienced the highest inflation rate in 2021, at a whopping 3.1 per cent compared to the rest of the country at 2.3 per cent.
Perak came next at 2.4 per cent, followed by Terengganu and Penang at 2.3 per cent each.
Pahang and Sabah experienced the lowest rates at 1.6 and 1.4 per cent respectively.
Food has been the primary inflation driver of a higher CPI in the last three years fuelled by prolonged supply disruptions and higher energy costs.
Headline inflation of food and beverages rose 4.1 per cent in May year-on-year, surpassing the overall CPI rate.
And regardless of how your inflation experience varies, the CKI suggests soaring prices affect most households much greater than what the official inflation indicated as households must now spend a bigger chunk of their budget just to buy food compared to just 12 months before.
Earlier this week, the government announced the removal of the ceiling price for chicken and chicken eggs, as well as subsidies for cooking oil in bottles of 2kg, 3kg and 5kg, from July 1.
Prime Minister Datuk Seri Ismail Sabri Yaakob said the subsidy for cooking oil in plastic packets will still be maintained by the government, and only that for bottled cooking oil will be removed.
He also announced a new round of cash aid as part of additional Bantuan Keluarga Malaysia (BKM) funds to combat rising prices, with the Phase 2 payment involving an allocation of RM1.11 billion and each BKM recipient will get up to RM400 depending on their respective BKM qualification category.


