


NOVEMBER 6 — Statistics are meant to inform, but sometimes they confuse. Take Malaysia’s household income figures. We keep hearing complaints of stagnant incomes and difficulties coping with the rising cost of living. But since the release of the Household Income and Basic Amenities Survey Report 2016 last month, an official success story is making the rounds – all the way to the 2018 Federal Budget speech.
The speech celebrates the rise in median household income, calculated from the Household Income Survey (HIS), from RM4,585 in 2014 to RM5,288 in 2016. Simultaneously, average household income, rose from RM6,141 to RM6,958, or at an annual growth rate of 6.4%. In real terms – that is, accounting for inflation – income grew 4.3% per year. The rest of this article refers to growth rates in real terms, which more accurately reflect purchasing power.
By the government’s account, household incomes have been growing quite substantially. Yet the budget is stacked with lavish handouts and financial relief, as though income growth has been sluggish, insufficient. Granted, this is an election budget, but clearly the proliferation of social assistance is also addressing a real groundswell of economic discontent.
Statistics should be validated by the reality they intend to measure. If the government reports that the Malaysian economy has grown by 10% this year, most of us would disbelieve that outright. It can’t be that high; the economy is not ballooning like the early- to mid-1990s! But looking at Malaysia’s steady international trade, investment and domestic consumption, visible construction projects, low unemployment, and economic conditions as a whole, the actual figure of about 5% GDP growth seems credible and plausible.
So why does the official report of rising household income seem incredible and implausible? Is income really stagnating, or is it flourishing but Malaysians are a whiney lot?
An examination of empirical evidence exposes three enigmas in the official household income statistics, raising questions on the reliability of the government’s high growth report.
First, income gains of the past half-decade are driven by inexplicably rapid growth in the 2012-2014 period, during which real household incomes expanded 8.2% per year – faster than in the booming 1990s (Figure 1). Furthermore, households in the bottom 40% (B40) enjoyed stupefying 14.6% income growth per year. Such hyper rates are usually the exception, but were supposedly the norm – during a time of modest 5.4% economic growth.

Two years ago, when the 2014 Household Income Survey Report documented a spectacular fall in inequality from 2012 to 2014, I raised concerns that those results departed too far from reality. This phenomenal success bypassed attention. It was not mentioned in the 2016 Budget speech; the government was apparently not taking its own statistics seriously.
In releasing the 2016 income statistics, the government reaffirms the questionable 2014 calculations – without explanation.
Of course, we might point to two outstanding policy shifts as income boosters: Minimum wage, which came into full effect in 2014, and BR1M, introduced in 2012. Their possible effects cannot be ignored.
But upon examination, these turn out to be the second and third enigmas in the income statistics. Minimum wage and BR1M fail to explain the rise in household income.
The official household income statistics aggregate various income components (the proper term is gross household income):
1. Income from wages and salaries, also including allowances, bonuses
2. Self-employment: Income through selling goods and services
3. Property and investment income: Land and property rent (including imputed rent of owner occupied homes), interest, dividends
4. Transfers received from public sources (BR1M, etc) or family members
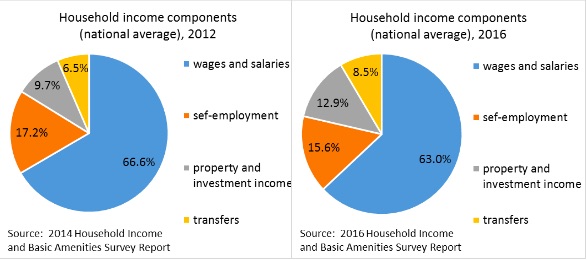
A breakdown of these sources shows that the share of wages and salaries in gross household income has declined, while the share of property and investment income and transfers have increased (Figure 2). Therefore, it is most unlikely that minimum wage contributed to high overall income growth.
Furthermore, when we compute growth rates household wages and salaries, we find modest numbers for 2012-2014 and 2014-2016 (Figure 3). Happily, we can compare this particular finding with calculations from another data source. Growth of individual wages and salaries, based on the Wages and Salaries Survey data, registered similar rates. Minimum wage surely boosted wage growth to some extent, as indicated by the higher rate in 2014 when it took effect. But it fails to account for rapid household income expansion.
BR1M is the last big factor standing. The share of transfers in household income increased – so far so good.
But the case for BR1M as an explanation for income growth soon crumbles. First, the BR1M payments are popularly known by the annual amounts paid, whereas household income is handled on a monthly basis. When investigating BR1M’s impact on household income, we must convert into their monthly amount. The problem with the BR1M explanation is that the quantum per month is so miniscule relative to household income per month. In 2012 and 2016, B40 household’s income averaged RM1,847 and RM2,848, while BR1M payments for households earning below RM3,000 per month, were RM42 and RM83 (RM500 and RM1000 divided by 12). BR1M accounted for only 2.3% and 2.9% of household income of the B40, its principal recipients.
The second pertains to timing. BR1M was introduced in 2012 at RM500 per year, increased to RM650 in 2014, then RM1,000 in 2016. The big differences took place in 2012 and 2016, not in 2014. However, the huge leap in household income occurred between 2012 and 2014!
In light of these enigmas, discrepancies and gaps, the government’s household income calculations for 2014 and 2016 remain implausible and demand a fuller accounting, particularly to provide reasons for the unfathomably high growth in property and investment income and transfers received.
There are empirical grounds, not just anecdote or intuition, to question the veracity of the official statistics, and to restrain celebration of Malaysia’s purported achievements in raising household income. One can speculate some possibilities. Perhaps transfers have been over-counted, or imputed rent over-estimated. For those living in houses they own, the gross household income numbers include an imputed amount of rent – that is, an amount they would receive if they rented out the house. Imputed rent, although it is not actual income received, is a useful piece of information. But it is misleading to include imputed rent in household income and report the sum as an indication of purchasing power and material well-being.
The Department of Statistics must be commended for publishing increasingly detailed reports on the 2014 and 2016 Household Income and Basic Amenities Surveys, but the disclosures are still inadequate. In line with the government’s commitment to Open Data, the natural next step should be to make the raw datasets accessible, to facilitate collaborative and constructive work and arrive at a fuller comprehension and credible measure of this vital issue of household income.
*Dr Lee Hwok Aun is Senior Fellow at the Institute of Southeast Asian Studies
**This is the personal opinion of the writer or publication and does not necessarily represent the views of Malay Mail Online.


