PUTRAJAYA, Sept 18 — As Malaysia chokes on smoke, its prime minister today said his government may make satellite data mapping of the regional locations of fire outbreaks and other information about haze hotspots available on official channels.
Tun Dr Mahathir Mohamad acknowledged the annual recurrence of the haze to be a touchy subject with Indonesia, saying others had raised it but resulting in a finger-pointing game.
“Our people have already raised this matter with Indonesian ministers, but they claim that the haze is originating from Malaysia.
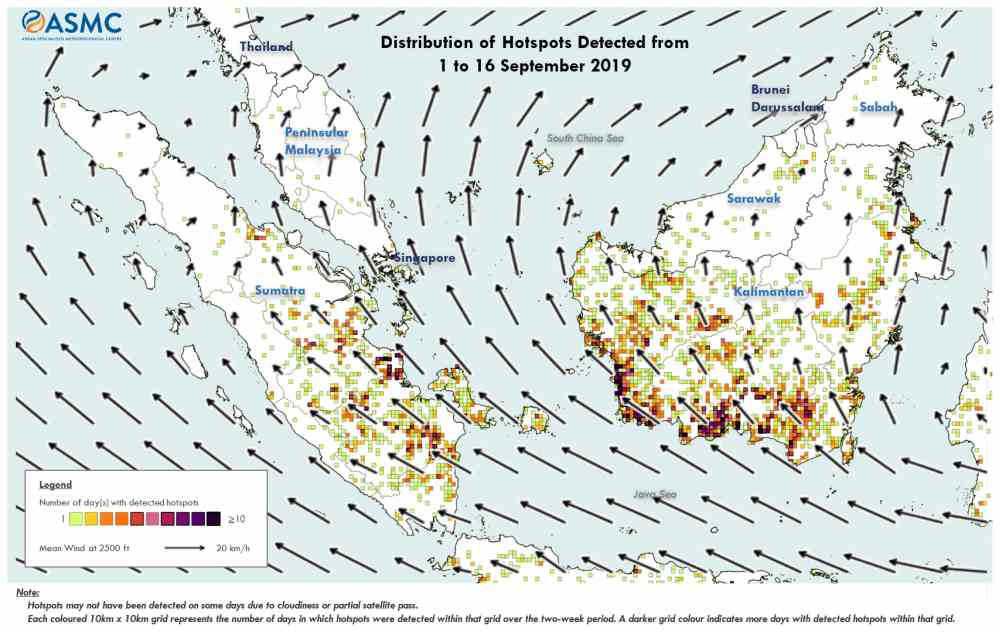
“That’s why I said we should publish maps showing satellite pictures of the actual hotspots,” he told reporters here this afternoon after launching the foreign policy framework.
He said the haze was among several issues discussed during today’s Cabinet meeting.
The ongoing transboundary haze had led to a brief exchange of the blame game between the Malaysian and Indonesian governments, with the latter insisting forest fires here had also contributed to the smog.
Energy, Science, Technology, Environment and Climate Change Minister Yeo Bee Yin had said the Indonesian government should acknowledge data that should more than 200 hotspots Kalimantan, adding it was their prerogative to take action against those caught breaking their laws.
Yesterday, Indonesian police announced the arrest of nearly 200 people over their alleged involvement with causing rapid forest fires there, and that four corporations are also being investigated.
The smog has caused the closure of schools in both countries, flight cancellations, triggering calls for an urgent regional meet to put an end to the annual plague.
Dr Mahathir had said the government are now mulling a new law that would allow them to go after Malaysian companies with estates abroad that contribute to the haze.